Financial markets are very competitive. There are many smart well-resourced players looking to find undervalued securities to buy and overvalued securities to sell. When people find an undervalued security, they buy it and that takes the price higher and when they find an overvalued security, they sell it taking the price lower. A lot of the players are very large institutions with a lot of resources and there are many of them. With lots of people competing furiously to find the mispriced securities, the result is that prices tend to be reasonably efficiently priced. As a result, it is very hard to beat the market. The historical evidence in the largest market with the most research on historical outcomes, which is the US market, shows that even most professional investors fail to beat the market after costs and fees. If large well-resourced institutions with teams trying to outperform the market have a hard time being successful, it is reasonable to expect that individuals who have much less time, training and resources are likely to fall short. The evidence shows this to be the case. If one accepts this premise that the very competitive nature of markets makes it hard to beat the “market”, the natural implication is that one should not invest a lot of time and resources in Picking Stocks, Picking Mutual Funds or Timing the Market because outperforming on any of these dimensions means that one is winning the competitive game to beat most of the other people playing this game.
The Evidence
Most institutional investors fall short of properly constructed benchmarks. Here is the evidence from US public Pension funds that manage billions of dollars with the benefit of large professional teams and the ability to hire almost any professional money manager or invest directly. An article by Richard M. Ennis examines the cost, performance, and benchmark bias of public pension funds in the United States. He estimates that statewide pension funds incur annual investment expenses averaging 1.3% of asset value and underperform passive investments by an average of 1.4% a year. He also finds that the funds report that they outperform their own benchmarks by an average of 0.3% a year, which raises questions about the integrity and usefulness of their performance reporting practices.
Most mutual funds fail to keep up with their benchmark indices. This is true in the US and is true in India.
S&P Indices Versus Active (SPIVA®) Scorecards
S&P Dow Jones Indices is one of the largest providers of investment indices. They have been doing a comparison of the performance of active versus index or passive strategies for the past twenty years called the SPIVA® Scorecards. The SPIVA Scorecards compare the performance of actively managed funds to appropriate benchmarks. The SPIVA Scorecards show that:
- the majority of actively managed funds across most categories and regions have underperformed their benchmarks over longer-term horizons.
- the performance of actively managed funds varies across market cycles, regions and asset classes, but there is no reliable way to predict when or where active management will outperform.
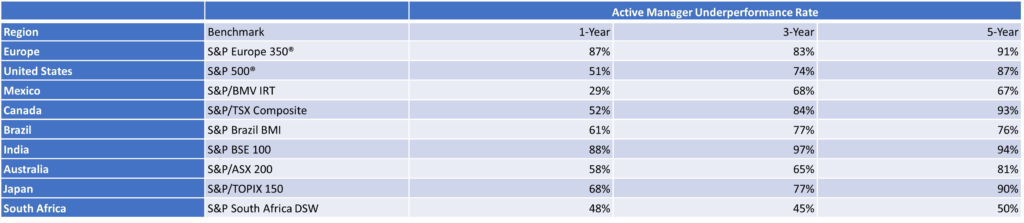
How significant has the rate of underperformance been? As the table below shows, quite significant.
Table 1: Percentage of Active Managers Underperforming Benchmarks
S&P Dow Jones Indices, U.S. Persistence Scorecard for year-end 2022, examines the persistence of active fund performance over different time horizons. The study finds little evidence of consistent skill among active managers, despite a relatively favorable environment for active management in 2022. It reports that:
- Only 6% of large-cap funds, 8% of mid-cap funds and 7% of small-cap funds maintained a top-half ranking over five consecutive 12-month periods.
- Only 2% of large-cap funds, 3% of mid-cap funds and 4% of small-cap funds maintained a top-quartile ranking over five consecutive 12-month periods.
- Only 1.5% of large-cap funds, 1.8% of mid-cap funds and 1.9% of small-cap funds maintained a top-quartile ranking over two consecutive five-year periods.
- Only 0.3% of large-cap funds, 0.5% of mid-cap funds and 0.7% of small-cap funds maintained a top-quartile ranking over two consecutive three-year periods.
- The majority of top-decile funds failed to remain in the top half over the subsequent five-year period across all fund categories.
- The majority of bottom-decile funds failed to escape the bottom half over the subsequent five-year period across all fund categories.
The study concludes that past performance is not a reliable indicator of future results and that active management success is more likely due to luck than skill.
SPIVA India Year-End 2022
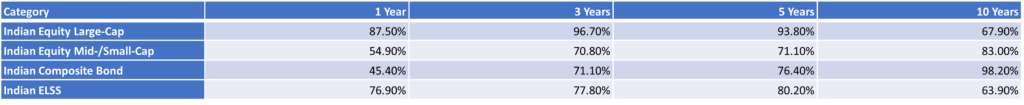
The study by S&P Dow Jones Indices compares the performance of actively managed Indian equity and bond mutual funds with their respective benchmark indices over 1-, 3-, 5- and 10-year investment horizons. The study finds that:
- A majority of Indian Equity Large-Cap funds failed to beat the S&P BSE 100 in 2022, with 88% of funds underperforming the index. The underperformance rates remained high over longer-term periods, except for the 10-year horizon, where 67.9% of funds underperformed.
- A majority of Indian ELSS funds also failed to beat the S&P BSE 200 in 2022, with 76.9% of funds underperforming the index. The underperformance rates improved over longer-term periods, especially for the 10-year horizon, where 63.9% of funds underperformed.
- A majority of Indian Equity Mid-/Small-Cap funds outperformed the S&P BSE 400 MidSmallCap Index in 2022, with only 38.5% of funds underperforming the index. However, the outperformance rates declined over longer-term periods, reaching 84.6% for the five-year horizon.
- A majority of Indian Composite Bond funds outperformed the S&P BSE India Bond Index in 2022, with only 45% of funds underperforming the index. The outperformance rates improved over longer-term periods, reaching 80% for the five-year horizon.
- A majority of Indian Government Bond funds underperformed the S&P BSE India Government Bond Index in 2022, with 65% of funds underperforming the index. The underperformance rates increased over longer-term periods, reaching 90% for the five-year horizon.
The study concludes that past performance is not a reliable indicator of future results and that active management success is more likely due to luck than skill. The study also discusses some methodological issues and limitations of the scorecard, such as survivorship bias, style consistency and benchmark selection.
If the large institutions are unable to keep up with the market, what should one expect for retail investors as a group? There is evidence that retail investors underperform the market.
Independent investment research firm Dalbar Inc., an independent research firm, publishes an annual Quantitative Analysis of Investor Behavior report, or QAIB for retail investors in the US.
It consistently shows that people are “more often than not their own worst enemies when it comes to investing, often succumbing to short-term strategies such as market timing or performance chasing.”
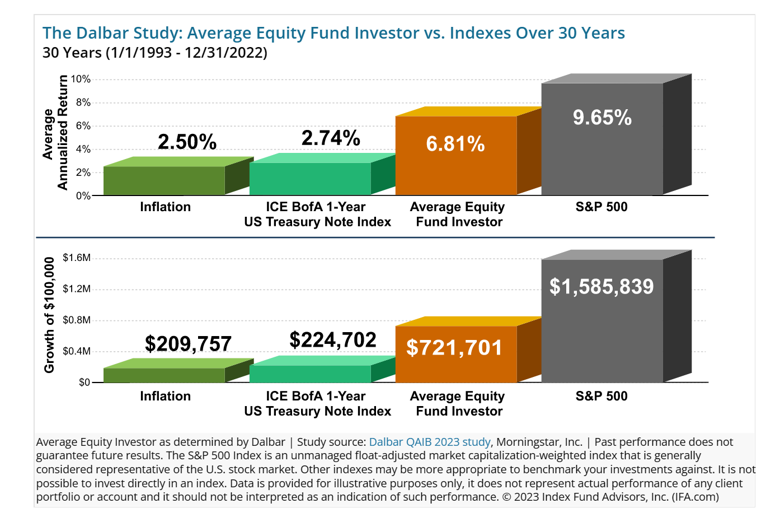
The bottom line: retail investors do quite poorly when compared to market benchmarks or index funds tracking the market.
In the Indian context too, there is evidence that retail investors fare poorly with active strategies. Here is a summary of the study “Analysis of Profit and Loss of Individual Traders dealing in Equity F&O Segment” by SEBI:
The study “Analysis of Profit and Loss of Individual Traders dealing in Equity F&O Segment” by SEBI analysed the profit and loss of individual traders dealing in the equity F&O segment during the period of April 2021 to March 2022.
The study found that “89% of the individual traders (i.e. 9 out of 10 individual traders) in equity F&O segment incurred losses with an average loss of Rs. 1.1 lakh during FY22, whereas, 90% of the active traders incurred average losses of Rs. 1.25 lakh during the same period.”
The conclusion
As an individual investor, so not spend time and resources trying to outperform the market by trying to actively pick individual securities like stocks and bonds or even actively managed mutual funds or time the market, hoping to outperform the average market returns. Instead focus on keeping up and not failing behind average market returns – Index Strategies do this very well and very efficiently at low cost. Make an exception to the above general strategy only when there are specific situations explicitly giving an advantage to individual investors that are not available to large investors and institutions – small government savings schemes and special tax advantages for individual investors.
If one thinks that one truly can do better than the average market outcomes, then rather than just adding value to one’s personal investment situation, one should really focus on getting a professional position in the investment management industry. The number of people who outperform the average after costs is truly small as has been pointed out in the evidence above. If you truly can be in this small group, you should be able to add a lot of value to professional investors and get paid very well for those results.