We are accustomed to using money as a stable store of value over short horizons. We have a tendency of evaluating portfolio outcomes and risk in nominal terms rather than in real terms which is what really matters over long horizons.
What do we mean by “nominal terms?” What is “real terms?”
Let us take an example.
You have an investment that delivers a return of 7% per year. The Rs. 1,000 you invested at 7% on 1st January 2021 gave you an additional Rs. 70 on 1st January 2022. You spend the Rs. 70 and invest the Rs. 1,000 once again at 7% on 1st January 2022 which gives you an additional Rs. 70 on 1st January 2023 leaving the Rs. 1,000 intact. If the return remains unchanged you will get an another Rs. 70 on 1st January, 2024. And so on.
The price of a masala dosa at your favourite Udupi restaurant on 1st January, 2022 is Rs. 70. You received the Rs. 70- return from your investment and spent it on the dosa on 1st January, 2022.
You want to eat a masala dosa at your favourite Udupi restaurant once again on 1st January,2023 when you receive the Rs. 70 return from the investment. You walk in with a swagger and order your favourite dosa and devour it hungrily. When you ask for the bill you get a shock when you realize you have to pay Rs. 77. You protest and speak to the owner who expresses his inability to reduce the price as the cost of input materials like flour and potatoes has gone up. You end up paying Rs. 77. Not only have you paid the earned interest but also an additional Rs. 7 leaving you with a lesser to invest for the future.
This is the impact of inflation and its relationship with investing.
On 1st January, 2023, you have received Rs. 70 in “nominal terms.”
However, in “real terms” it is worth less than it was worth on 1st January, 2022.
Why?
Because today’s Rs. 70 is not able to buy you the same amount of goods and services that it was able to buy you one year back.
The price of the dosa increasing from Rs. 70 to Rs. 77 is known as inflation.
Inflation can be defined as an increase in prices from one period to another. On the flip side, it could be described as the rate at which the value of money erodes or depreciates or loses its power to purchase. In the context of investment, it is the rate which they need to earn from their investments to keep their standard of living at the same level. If inflation in 10% and your “nominal” investment return is 7%, your “real” or effective investment return is minus 3%.
In economic terms, increase in the supply of money relative to the productive output leads to more money chasing fewer goods which results in inflation.
Inflation, though it seems opposed to the well-being of individuals, is supported by policy makers as it is believed to promote a stable, sustainable and predictable economic environment. However, at low/ moderate levels. When it goes beyond these levels, it can have deleterious economic outcomes.
If the price of everything were to rise at exactly the same rate, then it would not matter and nothing would change. People would not become richer or poorer as a result of inflation. However, not everything is impacted equally.
Among asset classes, the liquid asset classes tend to appreciate at a slower pace as compared to the less liquid asset classes. Hence, a move away from holding liquid assets is recommended as a strategy to counter the impact of inflation.
What should individuals strive for?
That their investments yield a return which is higher than the rate of inflation.
That their earnings increase annually at least as much as the rate of inflation.
The World Bank reports India’s inflation since 1960 as follows:
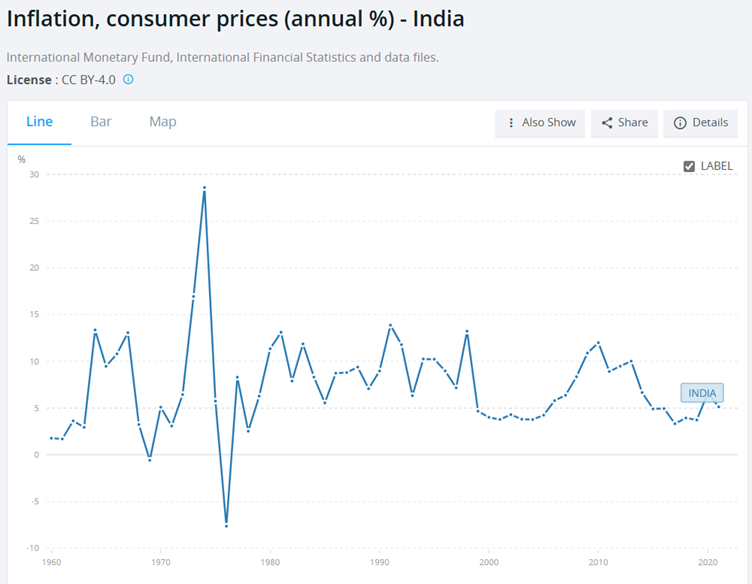
What this means is that the value of what a Rupee could buy has become smaller over time.
According to a calculator of World Data, if you could buy a certain basket of goods and services for Rs. 1,000 in 1961, in 2022, 61 years later, you need Rs. 78,071 to buy.
Its value against the US Dollar over a similar period of time tells the same story.
Another way of looking at the decline in the value of Rupee over time is its value against the US dollar, as shown in the chart below, produced by XE.com.
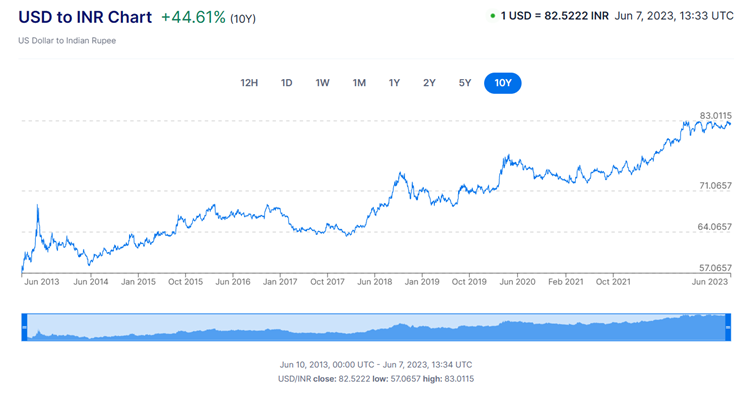
In June 2012, one could buy one dollar with 57 Rupees. In June 2022, one needs 82 Rupees to buy the same one dollar.